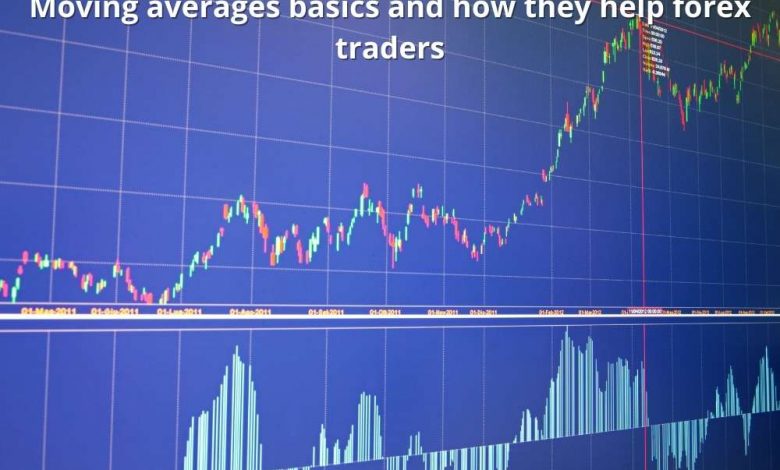
.MACD – How an analyst uses the moving average for convergence divergence
The Moving Average Convergence Divergence, MACD, developed by Gerald Appel in the 1970s, is a momentum indicator used by technical analysts. The MACD indicator offers traders and investors a measure of short-term momentum compared to long-term momentum. Which gives an indication of the direction of the current momentum.
The indicator is made up of two exponential moving averages (EMAs), which measure the price momentum of a security. The MACD is typically calculate by subtracting the (slow) 26-day EMA from the (fast) 12-day EMA. The
The common buy signal comes from the indicator when the MACD line crosses above the signal line. And the common sell signal is when the MACD crosses below the signal line.
Traders also watch the move above or below the centre line as this indicates. The relative position of the fast-moving average to the slow-moving average. When the MACD line is in positive territory, it is telling us that the fast-moving average is higher than. The slow-moving average and therefore there is an upward momentum in price.
Conversely, when the MACD line is in negative territory. It is telling us that the fast-moving average is below the slow. Moving average and therefore there is a downward trend in price. When the MACD line crosses above the centre line. It is telling us that there is a crossover in the moving averages. With one now higher than the other.
Price prediction of MACD
Traders also look for divergence patterns between the MACD and the security’s price movement. A bullish divergence forms when the security price hits a lower low, but the MACD forms a higher low.
The lower low in the security price confirms a current downtrend, but the higher low in the MACD shows less downside momentum. The slowdown in downside momentum may precede a change in trend or a sizable rally.
A bearish divergence forms when the price of security hits a higher high, but the MACD Line forms a lower high.
The higher high in the security price is normal in an uptrend, but the lower high in the MACD shows less upward momentum. The weakening of momentum to the upside may precede a trend reversal or sizable decline.
Bullish divergences often occur in a strong downtrend and bearish divergences often occur in a strong uptrend.
Thomas Aspray adds to the visual aspect of the MACD the introduction of a histogram in 1986, which highlights the difference between the MACD line and the signal line.
The histogram will be in the positive territory when the MACD line is above the signal line and it will be in the negative territory when the MACD line is below its signal line.
The highest histogram bars are (either in a positive or negative direction) the greatest momentum behind the direction the bars are pointing.
The typical time frames used in calculating the MACD lines and the signal are 12, 26 and 9, although a trader or investor may use alternative time frames depending on the trading style and goals.
However, one benefit that the MACD has compared to autonomous simple moving averages (SMA) or EMA is that it does not lag that far. the signal line crossover can be anticipated by the convergence testimony in advance of the actual crossover, the MACD does not stay as long as a basic SMA or EMA indicator crossover.
Conclusion:
Forex trading is the most volatile market in the world. You can make money if you have a proper plan and trading strategy. Most important the brokerage account must be with a good broker. The brokerage firm plays an important role in trading with its trading platform and leverage, fees, and safety.
Choosing the right broker is crucial. ROinvesting is the leading online brokerage firm that offers exceptional trading services with the best trading platforms and competitive fees and commissions.


